1 Getting Started
Note
This tutorial is a quick introduction to Qanat. It is intended for people who are new to Qanat and want to get a feel for what it can do. It assumes that you have Qanat installed and working (see installation for installation instructions).
Note
The code for this tutorial is available at: https://github.com/AmmarMian/qanat-tutorials/tree/main/basics/getting_started
1.1 Objectives
In this tutorial we build a simple experiment to compute the histogram of a randomly generated array of numbers. We can define the seed of the random number generator as a parameter of the experiment, and we can also define the number of bins in the histogram as a parameter. The experiment will be run on a single machine. This will be done using python with numpy library. We assume that python is installed on your machine and available thanks to the python command.
Note
Depending on your python installation, you may need to use python3 instead of python. Or alternatively, you can use an alias to your python executable:
alias python=your/python/executable
1.2 Setting up the Qanat project
Let us first create a repertory for our project that we call histogram:
mkdir histogram
cd histogram
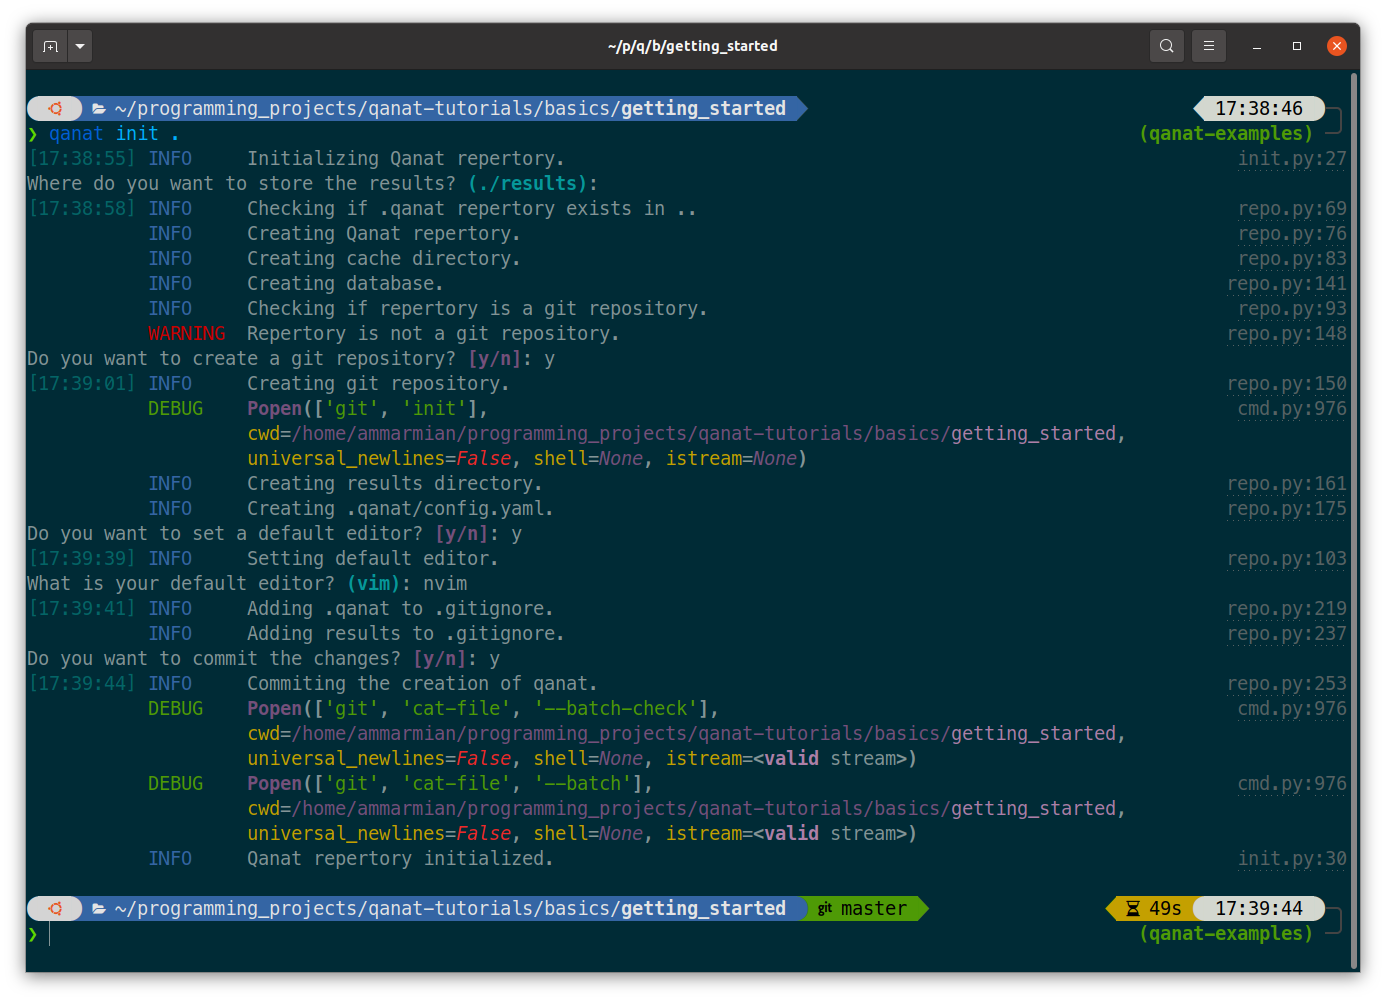
We can then initialize the project with the qanat init command:
qanat init .
After answering a few questions, this will create a .qanat/ directory that contains
the configuration of the project in a file called config.yaml as well as a file database.db
that contains the database of the project. The database is used to store the run history of the project.
Moreover, the directory is now a git repository, so you can use git to track the changes of your project.
You should have something like:
Note
At this point, the project is empty, so the database is empty and the git repository has a single commit for
the initialisation of the project. A .gitignore file has been created to ignore the .qanat/ directory
and the results directory.
Note
The .qanat/ directory is hidden by default. You can see it by using the -a option of the ls command.
> ls -a
 ./  ../  experiments/  .git/  .gitignore  .qanat/  results/
1.3 Creating experiment script in python
We can now create a python script that will contain the code of our experiment. In order to organise
better it is good practice to create a directory corresponding to the experiment and to put the script
in this directory. We can create the directory with the mkdir command:
mkdir experiments
We can then create a file histogram.py in experiments with the following content:
import numpy as np
import os
import argparse

if __name__ == "__main__":

     parser = argparse.ArgumentParser()
     parser.add_argument("--seed", type=int, default=0)
     parser.add_argument("--nbins", type=int, default=10)
     parser.add_argument("--storage_path", type=str, required=True)
     args = parser.parse_args()

     rng = np.random.RandomState(args.seed)
     data = rng.randn(1000)
     hist, bins = np.histogram(data, bins=args.nbins)

     results_path = os.path.join(args.storage_path, "results.npz")
     np.savez(results_path, hist=hist, bins=bins)
A simple script that use numpy library to generate a random array of numbers and compute the histogram.
The script takes three parameters: seed, nbins and storage_path. The first two parameters
are used to generate the data and compute the histogram. The third parameter is important as qanat use this
option to feed the script at which place it should store the results of the experiment.
To run the script without qanat, we can use the following command:
python histogram.py --seed 0 --nbins 10 --storage_path .
This will generate a file result.npz in the current directory that contains the histogram and the bins. This is nice but we want Qanat to track the run of the experiment and save the parameters used for us.
1.4 Adding the experiment to the project
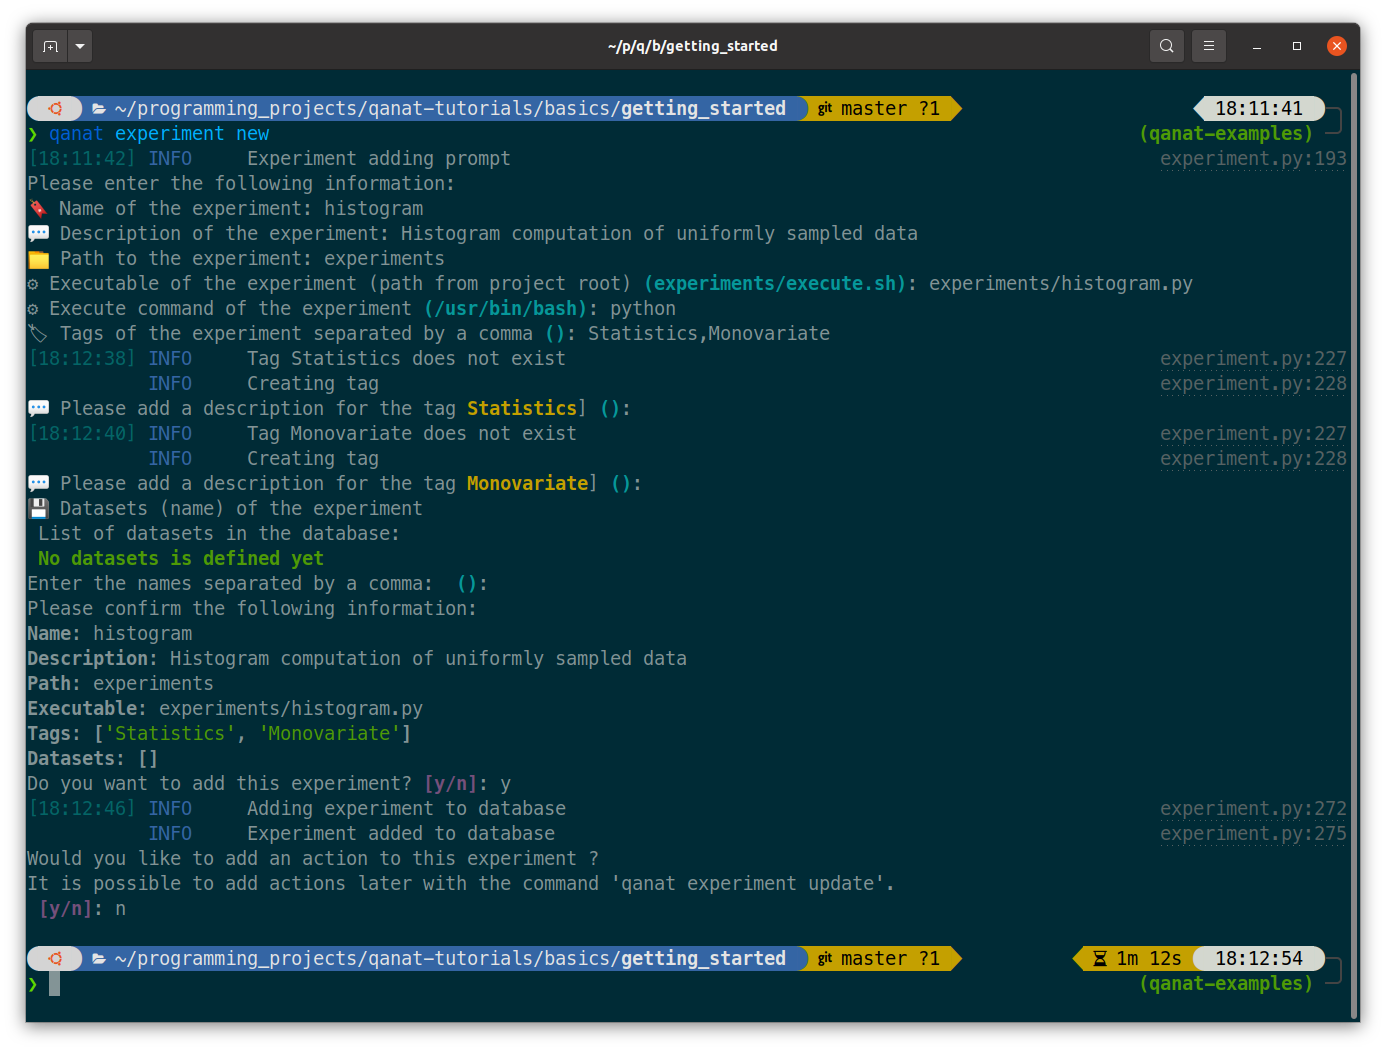
We need to tell Qanat about the experiment. This is done thanks to the qanat experiment command. To
add a new experiment to the project, we can use the following command:
qanat experiment new
This will show a prompt that will ask information about the experiment just like:
Note
We have added a description of the experiment. This is optional but it is good practice to add a description as it will help you to remember what the experiment is about. We also added tags to the experiment.
Note
Note that we didn’t bother with the datasets and actions for now. We will see those later.
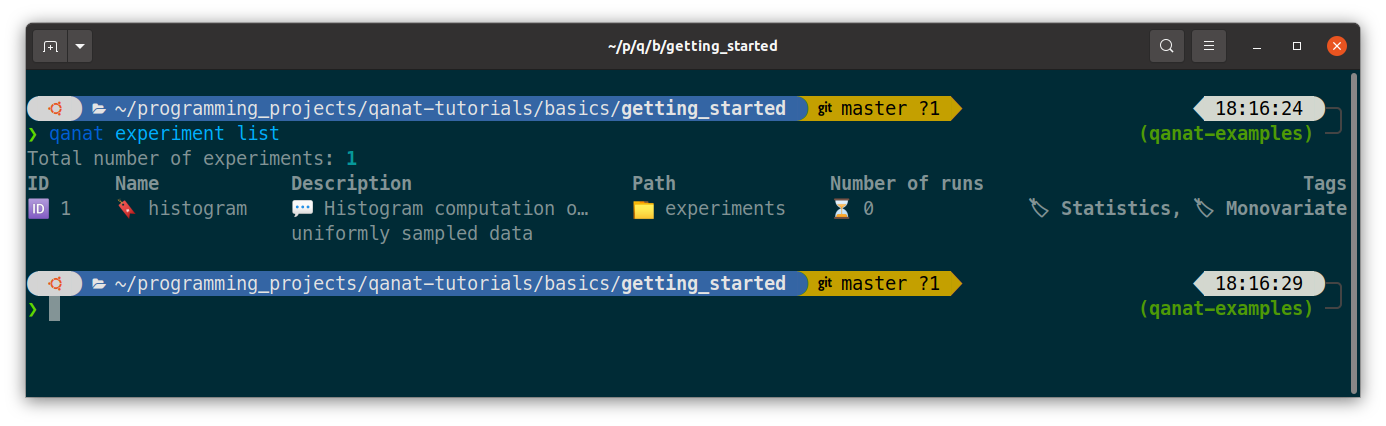
To check that Qanat has correctly added the experiment to the project, we can use the qanat experiment list command:
qanat experiment list
which will output:
1.5 Running the experiment
Let us run the experiment again with the same parameters but by using Qanat thanks to
the qanat experiment run command:
qanat experiment run histogram --seed 0 --nbins 10
This will tell you that the repertory is not committed to git and ask you if you want to commit it. You can answer y to this question. This will commit the repertory to git and run the experiment. The output of the command should be something like:
Note
Qanat will refuse to run the experiment if the repertory is not committed to git. This is to avoid running experiments without knowing exactly which verison of the code was responsible of the result. The commit_sha of the running code is always stored. This is also useful to reproduce the results of the experiment.
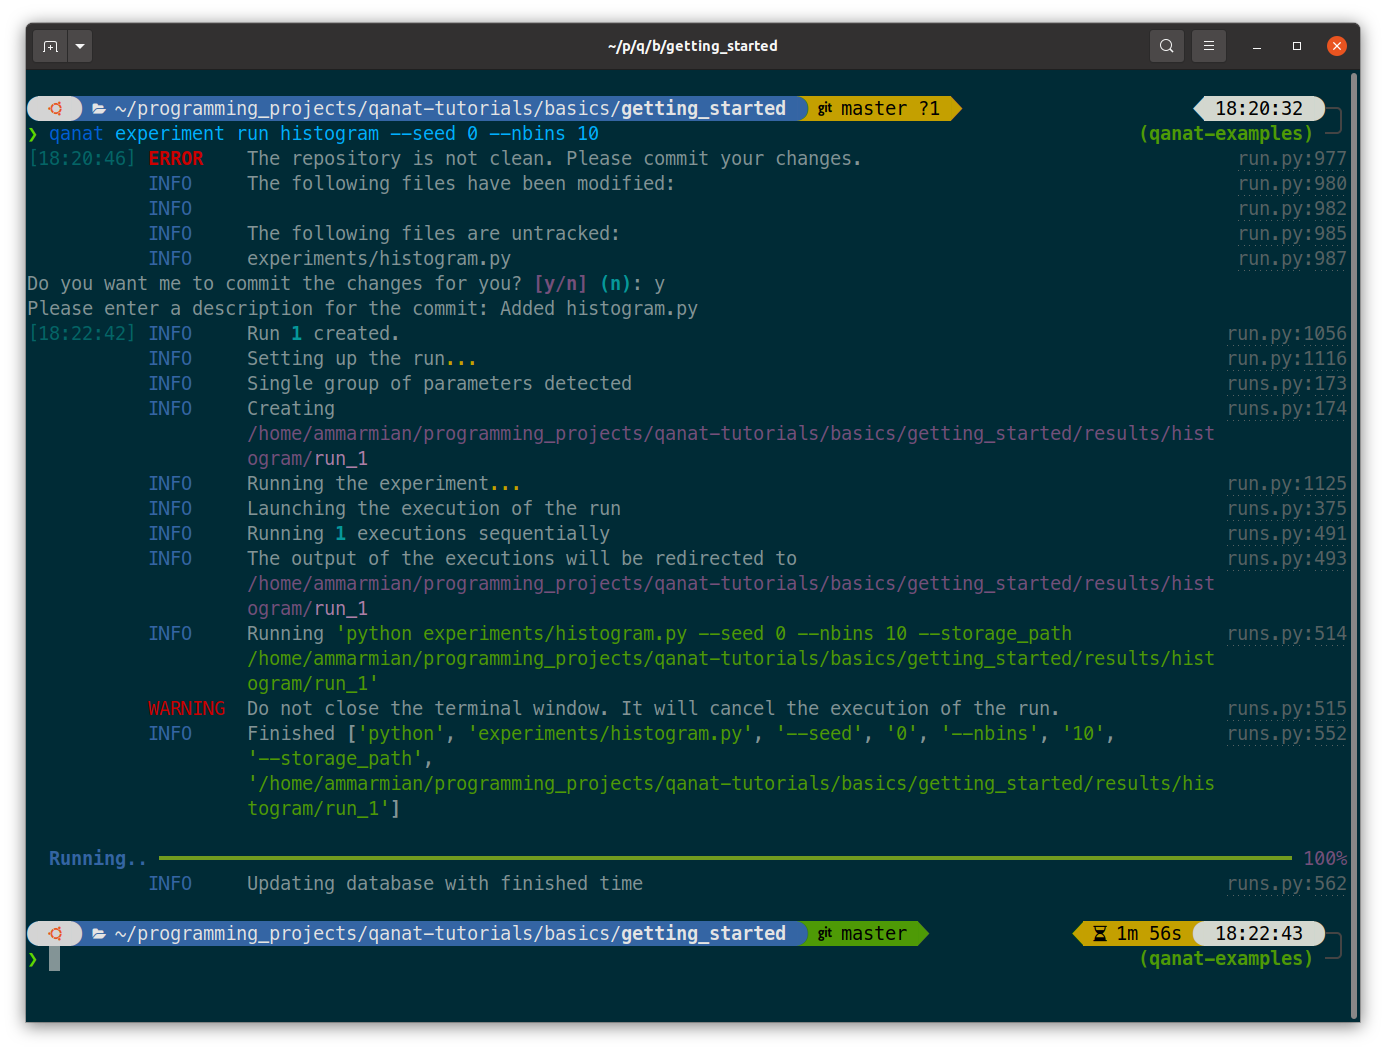
This will run the experiment and store the results in the results/histogram/run_1 directory. The results
directory is created automatically by Qanat. The run_1 directory is created by Qanat to store the results
of the first run of the experiment. If we run the experiment again, Qanat will create a run_2 directory.
The standard output and standard error of the experiment are stored in the stdout.txt and stderr.txt in this
directory.
> tree results
 results/
 └── histogram
     └── run_1
         ├── group_info.yaml
         ├── info.yaml
         ├── results.npz
         ├── stderr.txt
         └── stdout.txt

 2 directories, 5 files
Note that Qanat has created a group_info.yaml file and an info.yaml file. The group_info.yaml file
contains information about the group of the experiment. We will see later how to use groups. The info.yaml file
contains information about the run of the experiment. This file is important for qanat to track run status of the experiment.
1.6 Plot the histogram
This is nice but we want to plot the histogram. To do that we introduce the notion of Action: this is a script
that will be run after the experiment. We can create an action with the qanat experiment update command.
Since we separated the computation from the plotting, we will need in this plot scrip to read the data and do the plotting. As for the execution scrip, an action script will need to parse the option --storage_path to know
where the results are stored. When Qanat will run the action, it will pass the path to the results directory to the action script.
First let’s create a script plot_histogram.py in the experiments directory with the following content:
import numpy as np
import matplotlib.pyplot as plt
import argparse
import os

if __name__ == "__main__":

    parser = argparse.ArgumentParser()
    parser.add_argument("--storage_path", type=str, required=True)
    args = parser.parse_args()

    results_path = os.path.join(args.storage_path, "results.npz")
    results = np.load(results_path)
    hist = results["hist"]
    bins = results["bins"]

    plt.bar(bins[:-1], hist, width=bins[1] - bins[0])
    plt.savefig(os.path.join(args.storage_path, "histogram.png"))
    plt.show()
Now let’s add the action to the experiment with the qanat experiment update command:
qanat experiment update histogram
This will show a prompt that will allow to change actions. You will have something like:
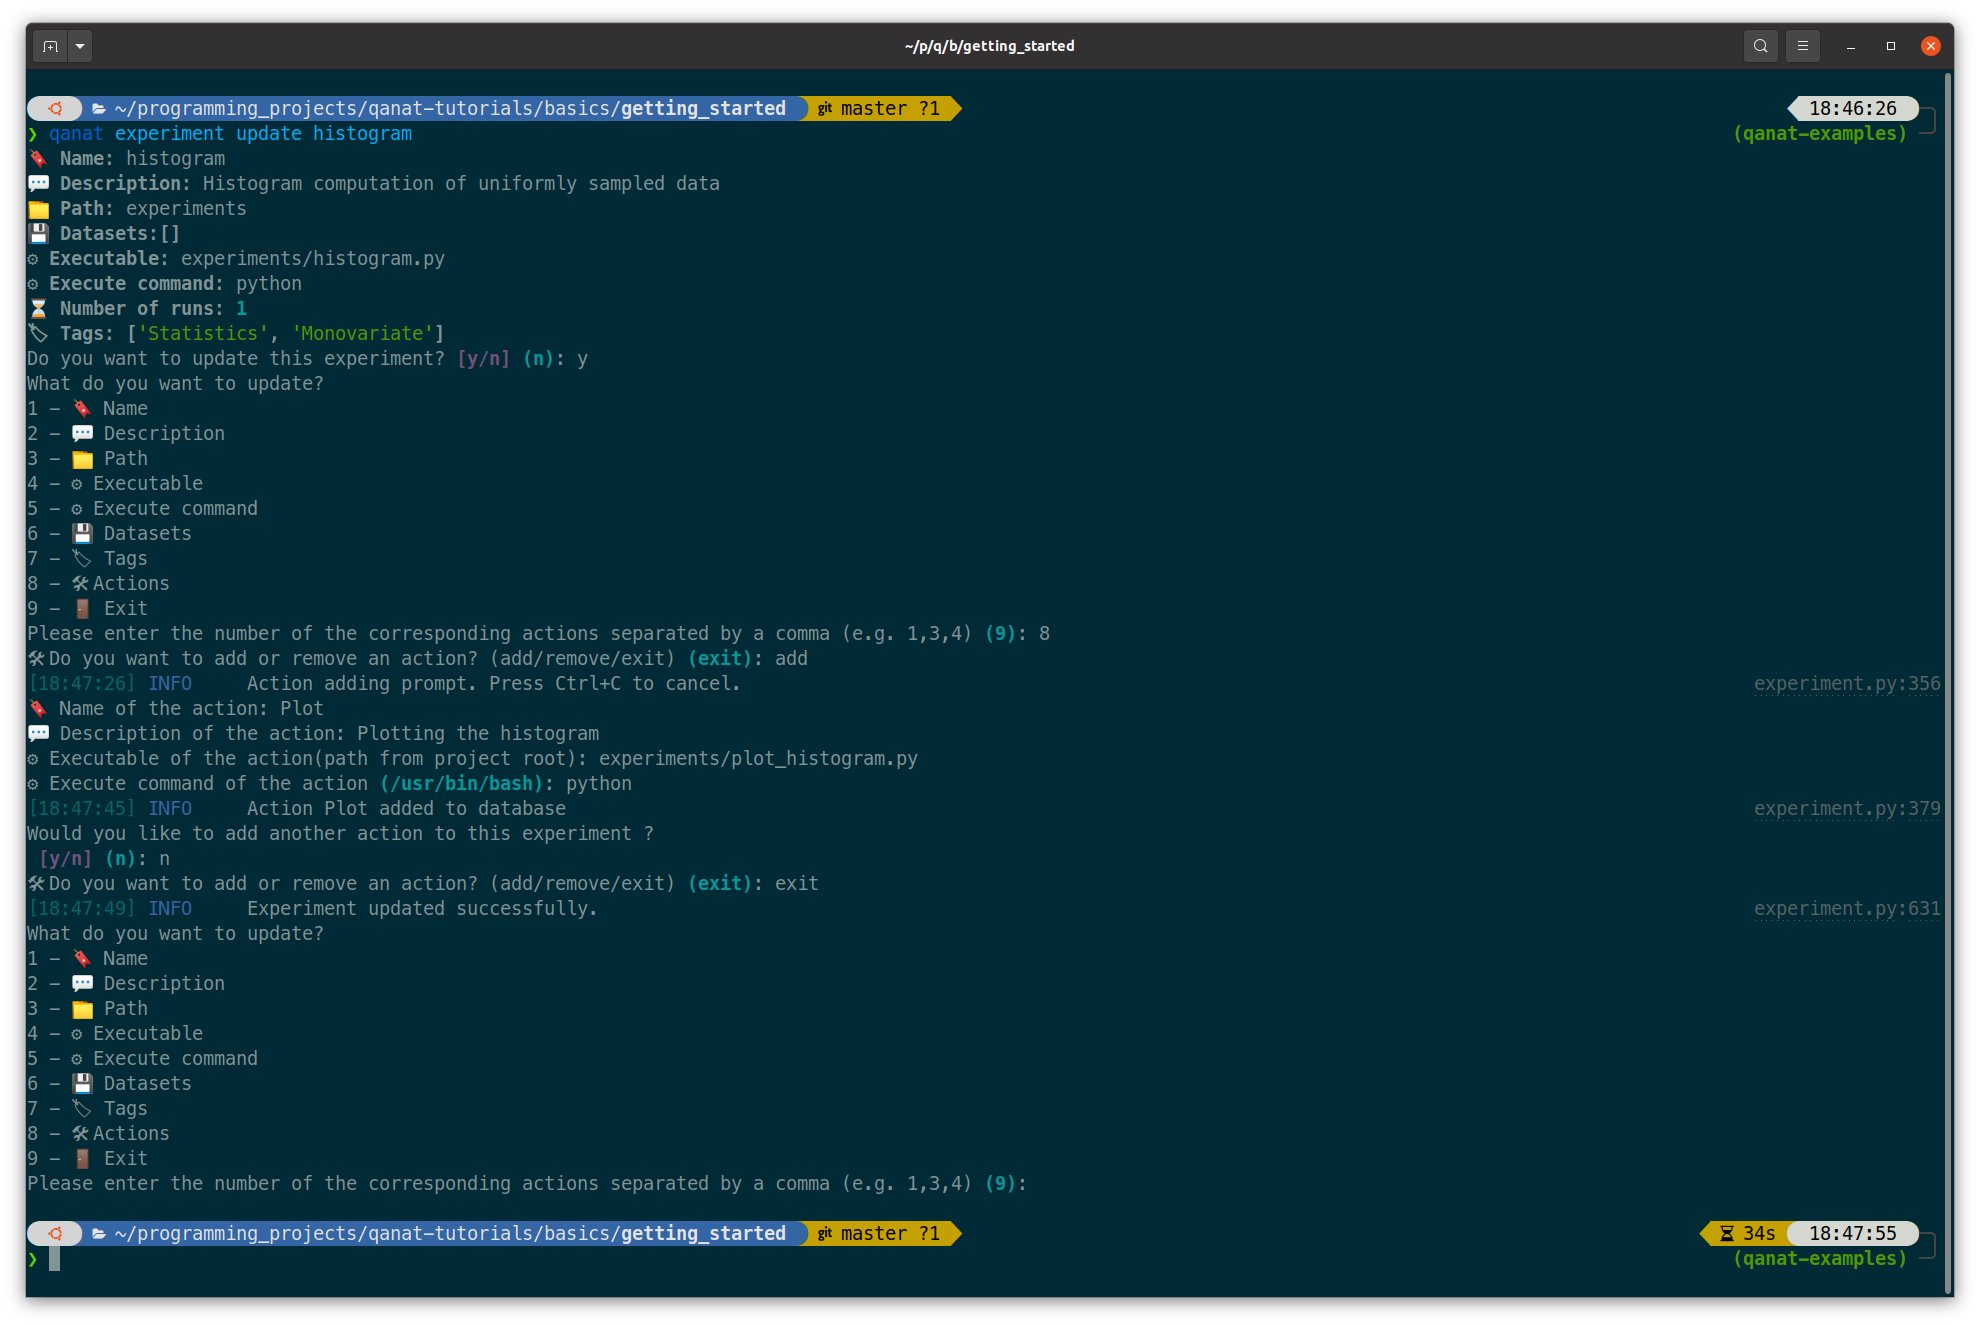
Note
Note that we have added a description to the action. This is optional but it is good practice to add a description as it will help you to remember what the action is about.
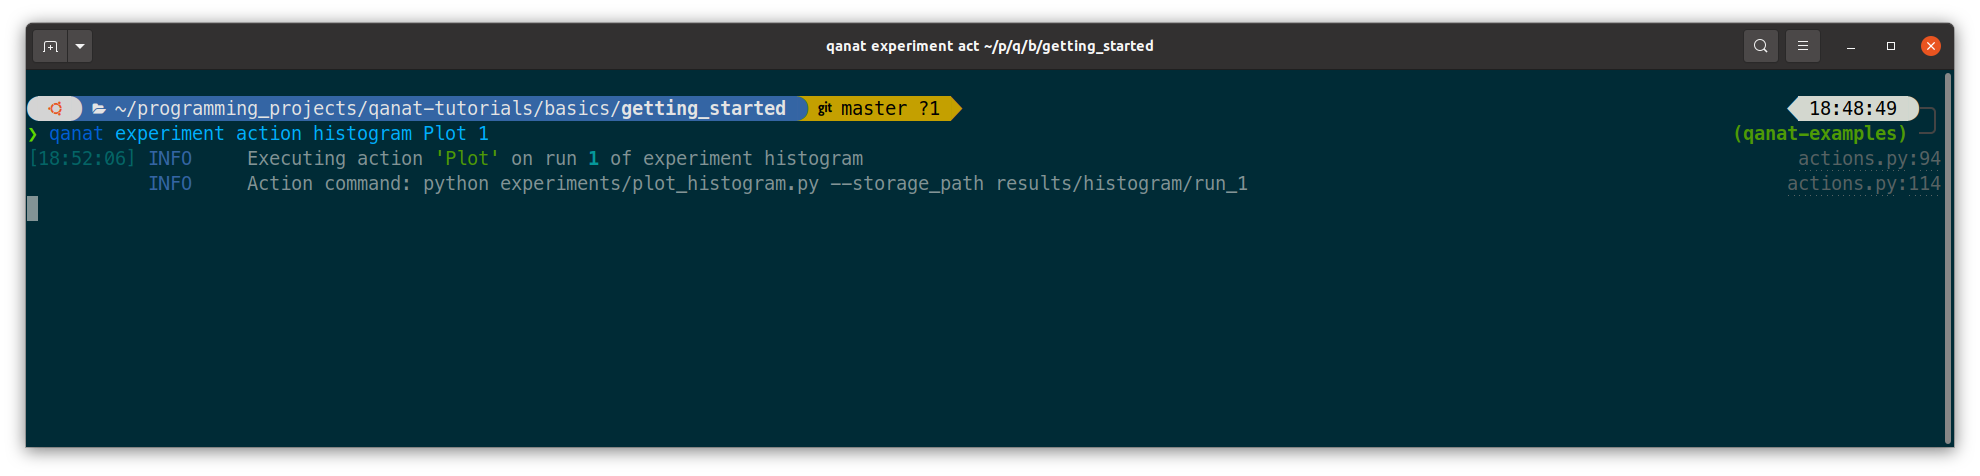
Now we can execute the action thanks to Qanat using the command qanat experiment action:
qanat experiment action histogram Plot 1
Note
We need to match exactly the name we gave to the action and precise on which run_id to execute the action on. Qanat will then get the path of the run and transfer to the action script.
This will run the action and store the results in the results/histogram/run_1 directory (Since we have done so in the action script). This will also show the plot of the histogram if GUI is available:
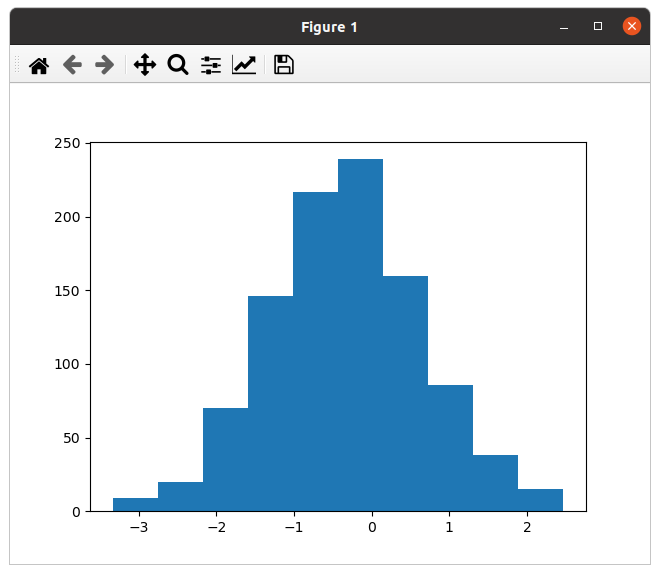
1.7 Playing with the parameters
Now let’s play with the parameters of the experiment. We can do that by using the qanat experiment run command. A special option allows to run the same experiment with different values of parameters. This is called a Group. For example let’s play on the number of bins:
qanat experiment run histogram --seed 0 -g "--nbins 10" -g "--nbins 20" -g "--nbins 30"
That will produce the following output:
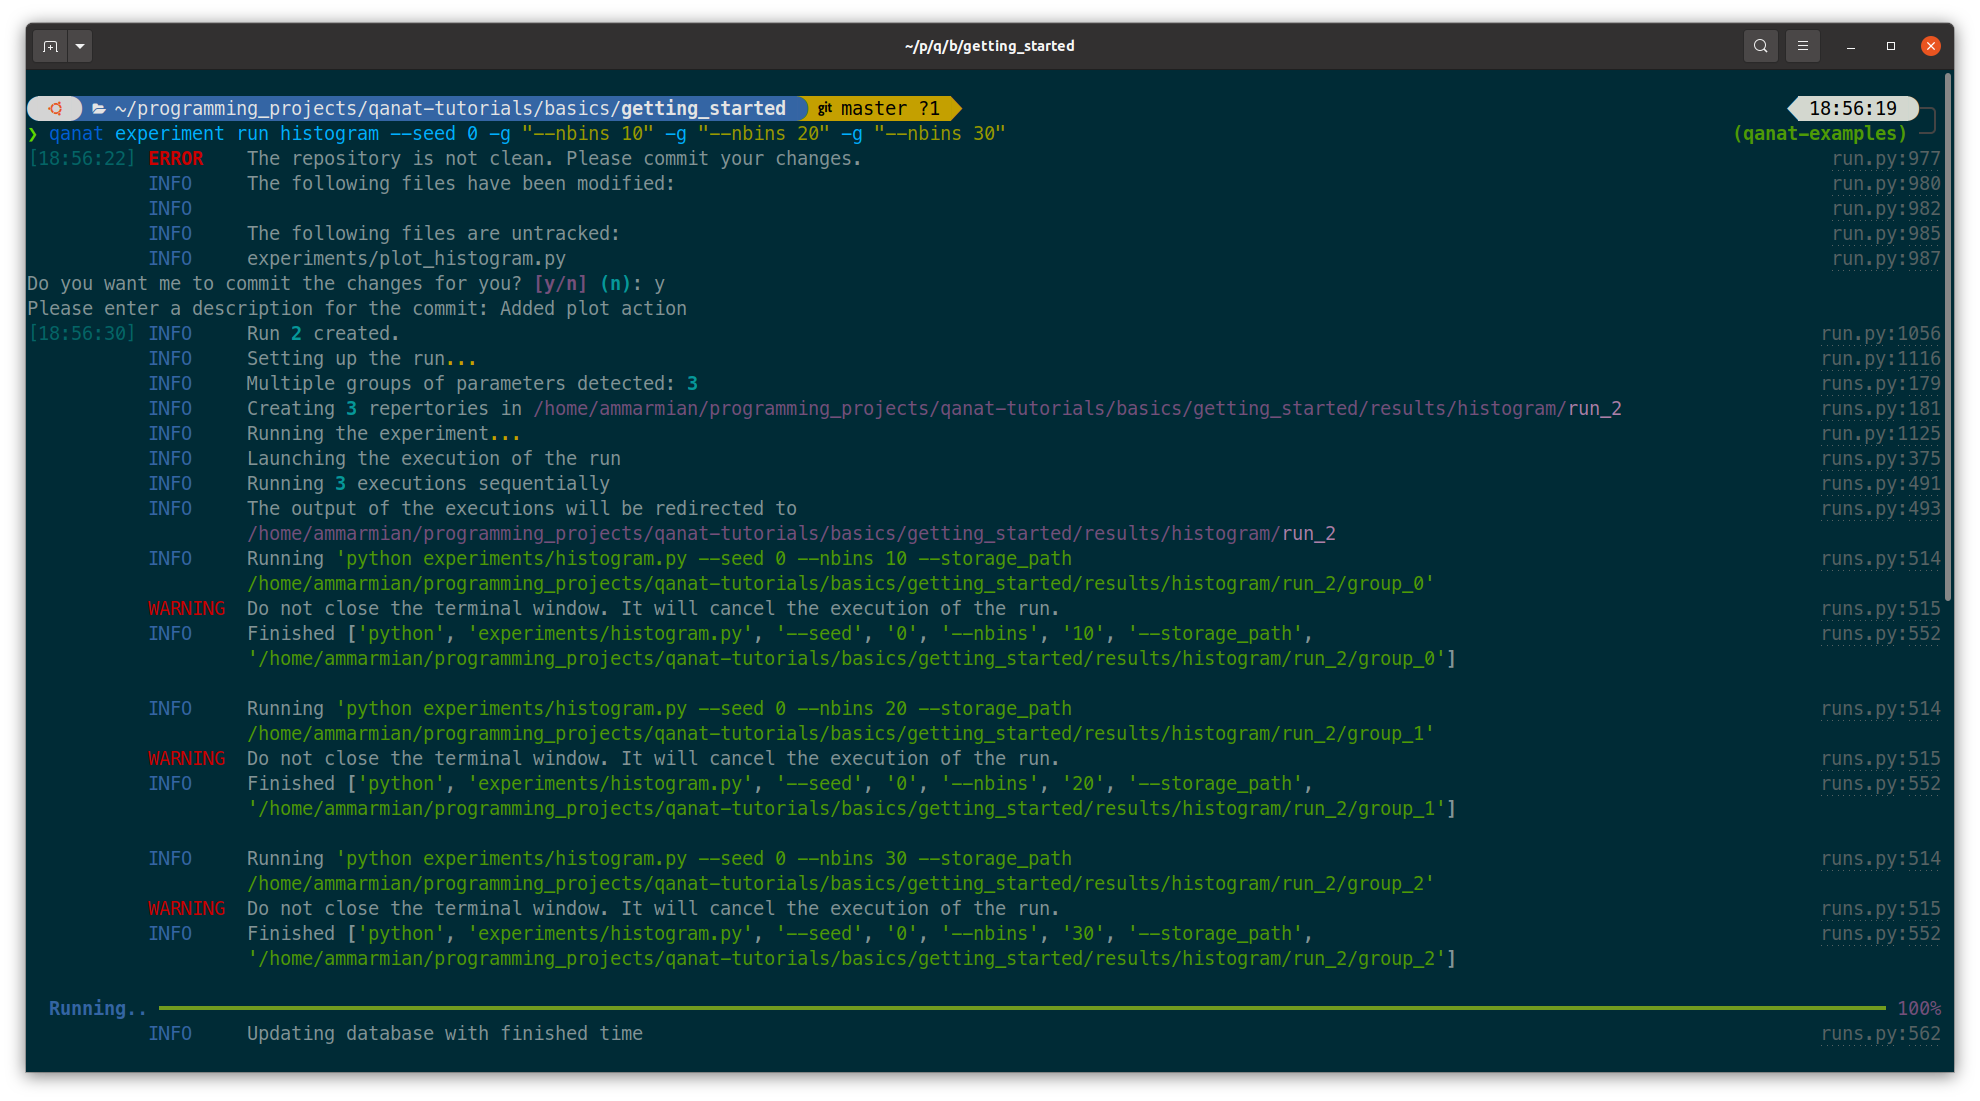
This will run the experiment with 3 different values of nbins. The results will be stored in the results/histogram/run_2/group_0, results/histogram/run_2/group_1 and results/histogram/run_2/group_2. The group_info.yaml will have the information on the run parameters for the group. The files are organised as follows:
> tree results
 results/
 └── histogram
     ...
     └── run_2
         ├── group_0
         │   ├── group_info.yaml
         │   ├── info.yaml
         │   ├── results.npz
         │   ├── stderr.txt
         │   └── stdout.txt
         ├── group_1
         │   ├── group_info.yaml
         │   ├── info.yaml
         │   ├── results.npz
         │   ├── stderr.txt
         │   └── stdout.txt
         └── group_2
             ├── group_info.yaml
             ├── info.yaml
             ├── results.npz
             ├── stderr.txt
             └── stdout.txt

 4 directories, 15 files
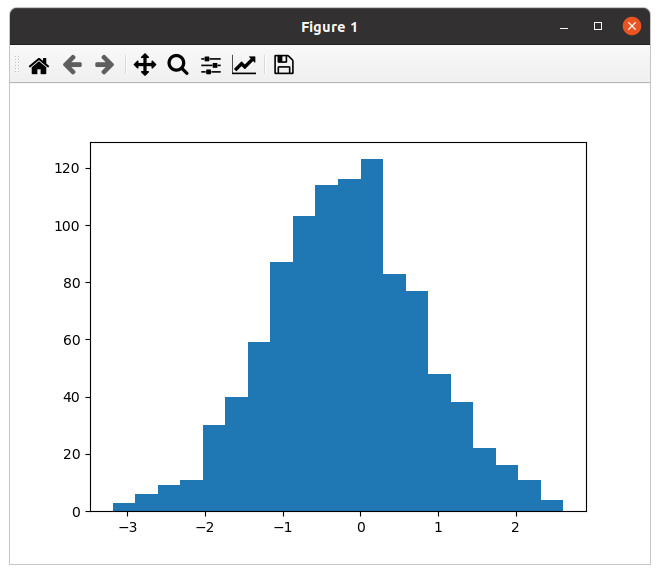
The problem now is that the plot_histogram.py script doesn’t deal with groups. We need to modify it to deal with groups or when doing the action we can use a special option --group_no that will run the action with storage_path to the path corresponding to a specific group:


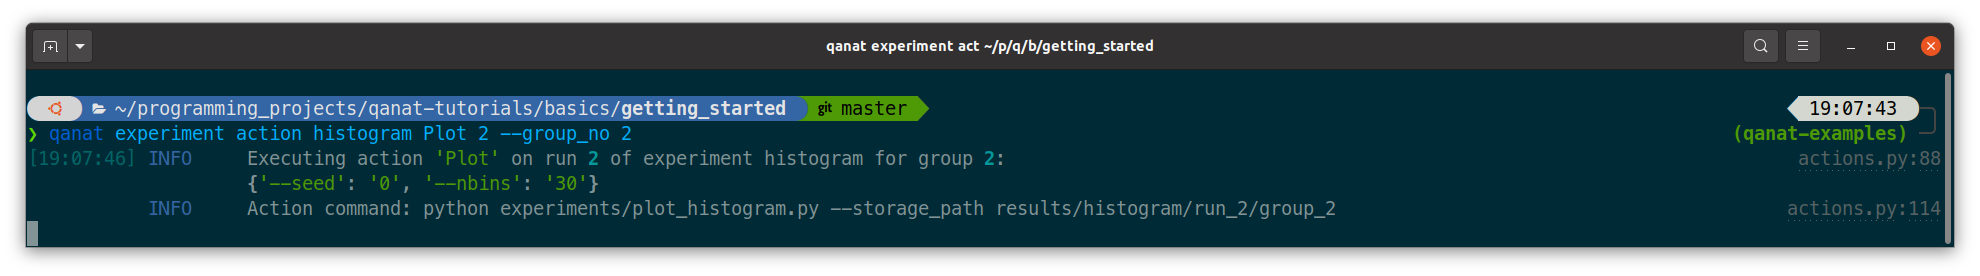
that will produce the following figures:

1.8 Managing runs
Qanat offers multiple way to know which runs have been done in the past. The first one is to use the qanat experiment status command:
qanat experiment status histogram
that will produce:
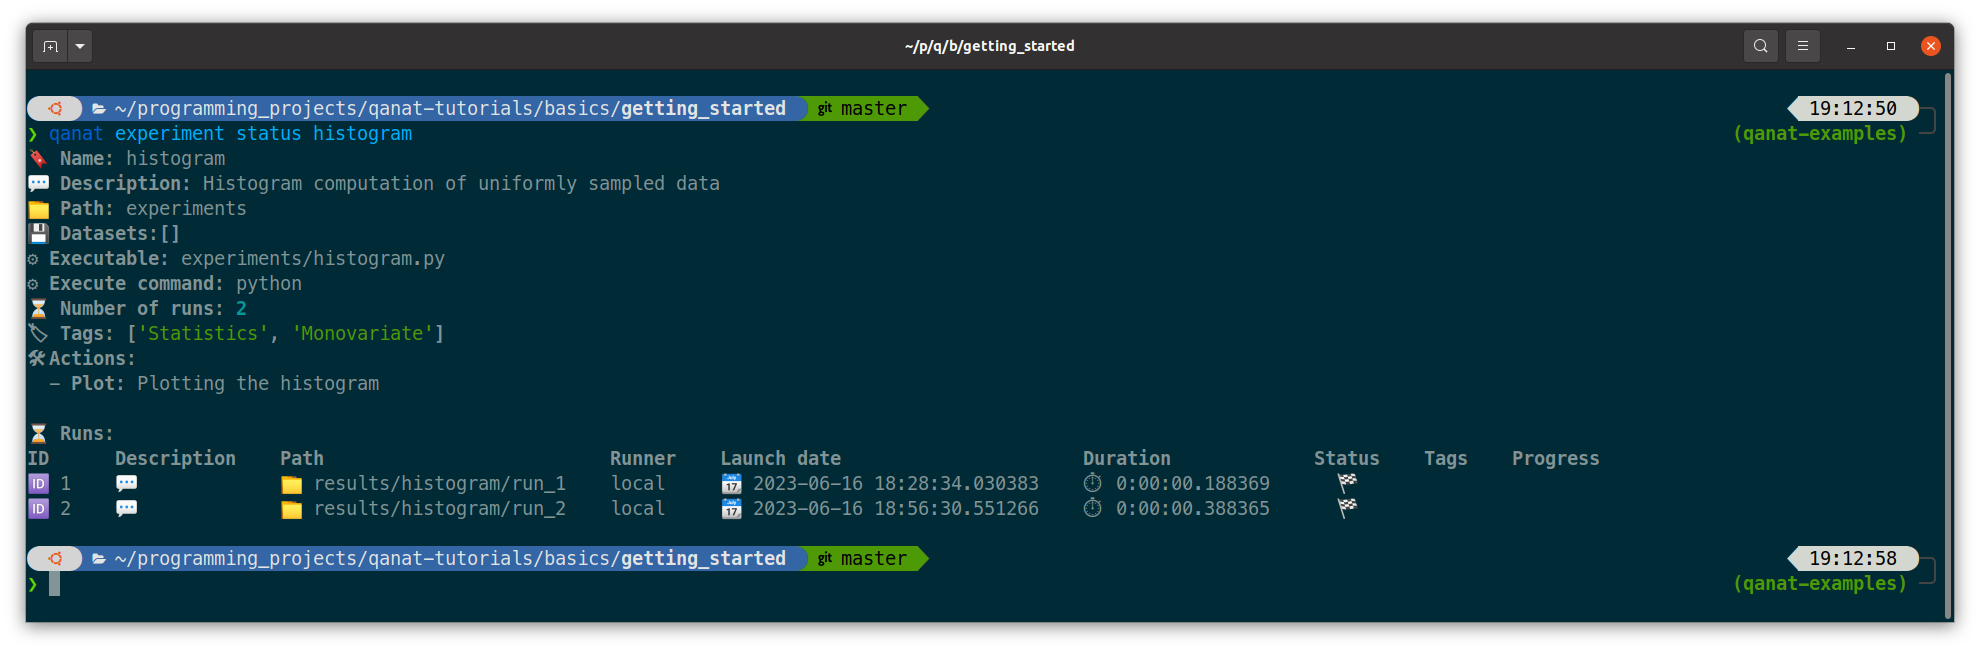
We can see that we have 2 runs. The first one is the one we did at the beginning of the tutorial. The second one is the one we did with the group.
Note
Note that we didn’t at this time but we can also associate description and tags to the runs. This can be done when running with options --description and --tags. See qanat experiment run --help for more info on that.
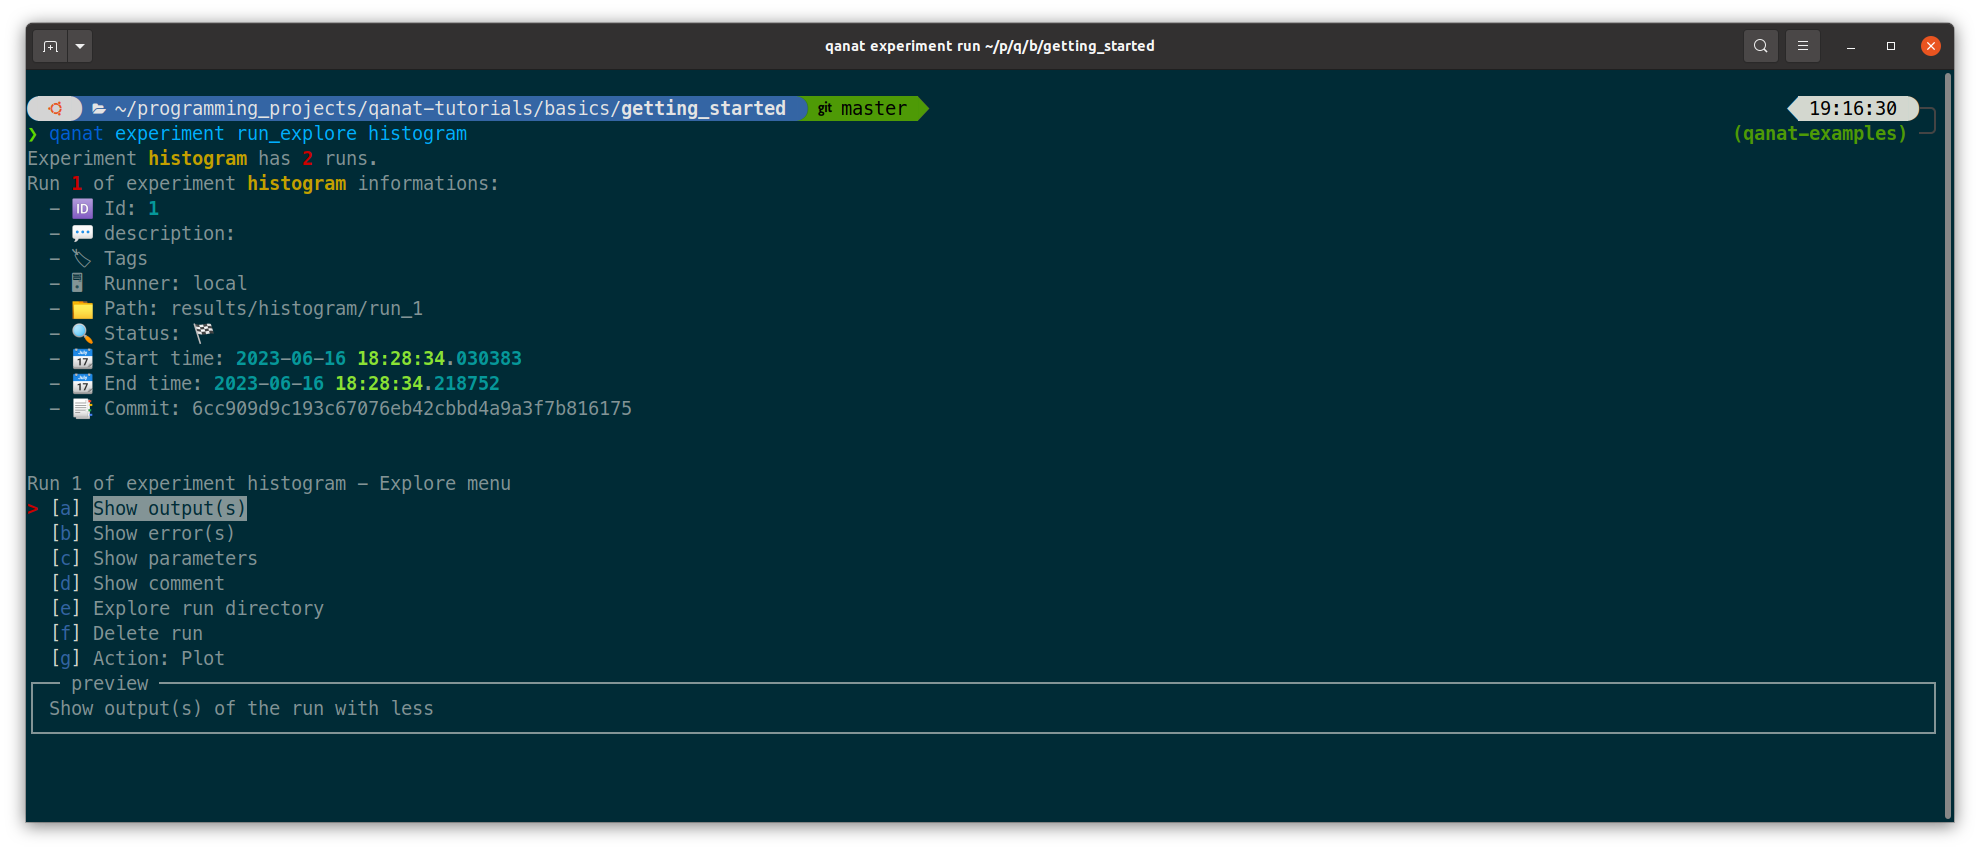
The second way to know which runs have been done is to use the qanat experiment run_explore command:
qanat experiment run_explore histogram
that will allow you to explore the runs thanks to either a menu or by a search function. The menu will look like:
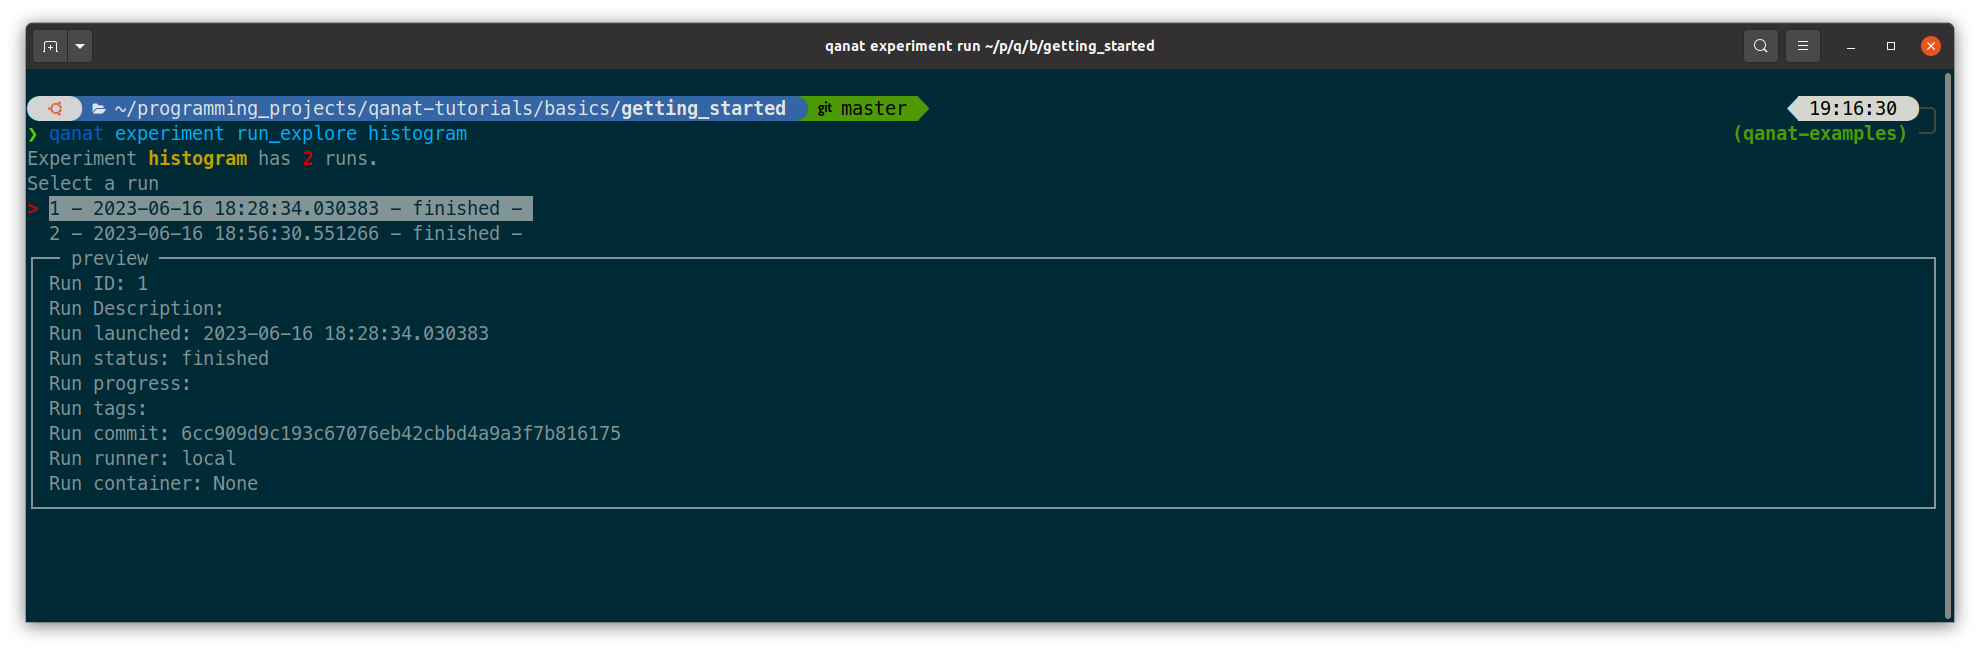
By pressing enter on a run, there are a few commands available:
Note
Note that the qanat experiment run_explore command can also be used to run an action on a run. This can be done by pressing the corresponding action in the menu.
1.9 Conclusion
This tutorial has shown how to use Qanat to run an experiment and to analyse the results. We have seen how to add actions to the experiment and how to run the experiment with different parameters. We have also seen how to explore the results of the experiment.
There are many more features in Qanat that are not covered in this tutorial. Please refer to the documentation for more information.